Cambridge IELTS 1 Writing Task 1 Test 1 Evaluated Sample Essay


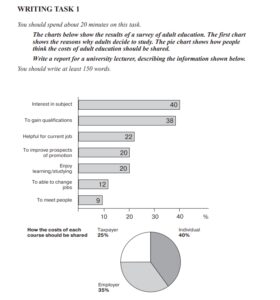
The charts below show the results of a survey of adult education. The first chart shows the reasons why adults decide to study. The pie chart shows how people think the costs of adult education should be shared. Write a report for a university lecturer, describing the information shown below.


Task 1

The diagrams illustrate the finding of the survey of adult schooling. The first figure describes the facts about adult’s decisions of studying and second displays expected shares of their educational expenses.
Overall, it can be seen that adult study for different reason but majority of them study for their interests and to gain particular qualification. Significant proportion of expenses is bear by candidate itself.
Highest proportions of adults such as 40% and 38% study because of their interests in subjects and to acquire certain qualification respectively. 22% of them want to support their current jobs. While equal number of adults (20%) study for their promotions and enjoy learning purposes. Little percentage of 12% study to make them eligible to change jobs. Rest of the 9% adults wants to improve their communication skills which can help them to meet new people. Moreover, people thought that adults’ educational expense must be shared among employers, taxpayers and candidates itself. Major share of 40% of their education must be arranged by themselves, whereas remaining 35% by employers and 25% by taxpayers.
 
Evaluation 
 
(DELETE The diagrams illustrate the (finding?) of the survey of adult schooling.) The (BAR GRAPH) (DELETE first figure) describes the facts about adult’s (REASONS) (DELETE decisions) of studying and (DELETE second) ( PIE CHART ) displays expected shares of their educational expenses. CALIBRATION IS MISSING)
 
Overall, it can be seen that adult study for different reason(S) but majority of them study for their (SUBJECTS’) interests and to gain particular qualification. Significant proportion of expenses is bear by candidate itself.
 
Highest proportions of adults such as 40% and 38% study because of their interests in subjects and to acquire certain qualification respectively. 22% of them want (WANTED) (USE PAST TENSE WHEN TIME FRAME WAS GIVEN) to support their current jobs. While equal (ALMOST) number of adults (20%) study for their promotions and enjoy learning purposes. Little percentage of 12% study to make them eligible to change jobs. Rest of the 9% adults wants to improve their communication skills which can help them to meet new people. Moreover, people thought that adults’ educational expense must be shared among employers, taxpayers and candidates itself. Major share of 40% of their education must be arranged by themselves, whereas remaining 35% by employers and 25% by taxpayers. (SPLIT THIS IN 2 PARAGRAPHS AND EXPLAIN MORE TO BEAT 150 WORDS, WHEN THERE ARE 2 FIGURES, ASSIGN 1 EACH TO BODY PARAGRAPH, EG. BP1- BAR GRAPH AND BP2 – PIE CHART)
 
YOU MISSED MANY DETAILS TO ELABORATE THE TASK. PLEASE REFER THE BOOKS POSTED UNDER FILE SECTION AND LEARN THE STRUCTURE FIRST BEFORE ATTEMPTING TASK 1. IT IS VERY IMPORTANT
 

Predicted score

Join us on Telegram for more guidelines
Lexical resource = 7
Coherence and cohesion= 6
Task response = 5
Grammar (and Trivial Errors) =7

We have published several articles and guidelines for Cambridge IELTS writing task1 and task 2. 

These articles cover the tips when it comes to IELTS writing. 

If you have some questions, please feel free to ask in comments below. Thanks for reading this article and share it with your friends so they can prevent these common mistakes. For more information and tips, visit Facebook group IELTS Assistance (Free Writing Evaluation & Guidance).