
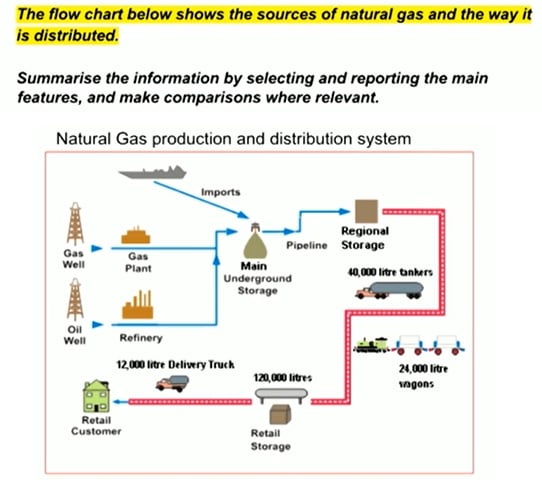
Essay 1 original: diagram provides information about the process involved in production, storage and distribution of the natural gas.
In initial phase either gas or oil can be used for production of natural gas. Gases generated from gas wells and oil originated from oil wells, transferred into gas plants and oil refineries respectively, for further processing and operations to produce natural gas.
After that produced natural gas from both of sources transferred into the main underground storage using pipelines. The imported ready to use gases also stored in this storage section. In next step, natural gas piped to the region storage from the main storage for distribution.
It is then transported to retail storage tanks either by road using 40,000 liters oil tankers or through railway system via 24,000 liters wagons.
At the final stage, the gas is conveyed to retail consumers via roads with the assistance of 12,000 liter delivery trucks.
Essay 1 evaluation
The diagram provides information about the process involved in production, storage and distribution of the natural gas.
OVERVIEW IS MISSING
In initial phase COMMA either gas or oil can be used for THE production of natural gas. Gases generated from gas wells and oil originated from oil wells, transferred into TO THE gas plants and oil refineries respectively, for further processing and operations to produce natural gas.
After that COMMA produced natural gas from both of THE sources transferred into TO the main underground storage (DELETE using pipelines). The imported ready to use gases also stored in this storage section. In next step, natural gas piped to the region(AL) storage from the main storage for distribution. It is then transported to retail storage tanks either by road using 40,000 liters (CHECK SPELLING) oil tankers or through railway system via 24,000 liters (SPELLING) wagons.
At the final stage, the gas is conveyed to retail consumers via roads with the assistance of 12,000 liter (SPELLING) delivery trucks.
WORK ON YOUR EXPRESSIONS, TRY TO ELABORATE MORE BRIEFLY. UTILIZE LINKING WORDS.
Lexical resources = 5
Coherence and cohesion= 6
Task response = 6
Grammar (and Trivial Errors) = 5
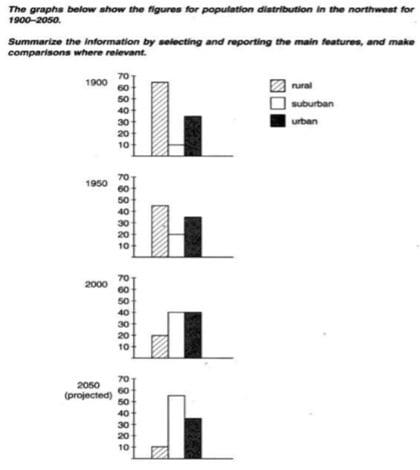
Essay 3 original: The graphs compare population classification into rural, suburban and urban areas of the northwest over a period of 150 years from 1900 to 2050.
Overall, it can be seen that a large number of populace has shifted from rural areas to suburban areas. Moreover, It is expected that population of suburban regions will be more than total residents of rural and urban areas in next three decades.
Looking at 1900, most people preferred to live in rural zones, approximately 65% of total inhabitants were in rural areas. It was followed by residents of urban areas, which was around 35% of total population. The urban regions were only occupied by rest of 10% humans of the northwest.
In the next half century, the 20% populace of urban regions migrated to suburban regions. However, the total population of urban areas remained almost unchanged. Moving towards 2000, the number of inhabitant of suburban zones doubled. The populace of urban areas also increased slightly to 40%. On other hand, population of rural regions experienced sharp fall and only 20% residents of northwest remained there.
It is forecasted that, in 2050 the populace of suburban areas will be reached at peak of 60%. Whereas, the population of urban areas expected to remain unchanged. Unlike, both of them there will be further drop in number of residents of rural regions.
Essay 3 Evaluation (1)
The graph compares GRAPHS COMPARE population classification into rural, suburban and urban areas of the northwest over a period of 150 years from 1900 to 2050.
Overall, it can be seen that a large number of the populace has shifted from rural areas to suburban areas. Moreover, it is expected that the population of suburban regions will be more than e ?? total residence RESIDENTS of rural and urban areas by 2050 (DELETE in the next three decades).
Looking at 1900, most people preferred to live in rural zones, approximately 65% of THE total inhabitants were in rural areas. It was followed by residents of urban areas, which was around 35% of total the population. The suburban regions were only occupied by the rest of 10% inhabitants.
In the next half century ( THIS COULD MEAN 50 YEARS FROM NOW TOO. SO, MENTION THE YEAR AS WELL), the 20% populace( DO NOT REPEAT THE WORDS) of rural regions migrated to suburban regions MENTION THE EXACT FIGURES TOO. However, the total population of urban areas remained unchanged. Moving toward(S) THE YEAR 2000, the number of THE inhabitant of suburban zones doubled. The populace of urban areas also increased slightly to 40% and rural regions experienced sharp fall.
It is forecasted that NO COMMA, in 2050 the populace of suburban areas will be peaking at 60%. Whereas, the population of urban areas EXPECTED TO REMAIN (DELETE will be) unchanged and there will be a further drop in residents of rural regions. NO FIGURES?
INSTEAD OF 3 body paragraphs, MAKE 2. UTILIZE LINKING WORDS. REPORT IS ALL ABOUT THE DATA. YOU EXPRESSED MORE IN WORDS THAN FIGURES.
POSSIBLE SCORES:
Lexical resources = 5
Coherence and cohesion= 5
Task response = 5
Grammar (and Trivial Errors) = 6
Essay 3 evaluation (2)
The graphs compare population classification into rural, suburban and urban areas of the northwest over a period of 150 years/(OVER A PERIOD OF A CENTURY AND A HALF) from 1900 to 2050.
Overall, it can be seen that a large number of the populace has shifted from rural areas to suburban areas. Moreover, it is expected that the population of suburban regions will be more than/SIGNIFICANTLY/TREMENDOUSLY INCREASE MORE THAN) the total residents of rural and urban areas in the next three decades.
Looking at 1900, most people preferred to live in rural zones, approximately 65% of total inhabitants were in rural areas/(COUNTRYSIDE.) It was followed by residents of urban areas, which was around 35% of total the population. The suburban regions were only occupied by the rest of 10% inhabitants.
In the next half century, the 20% populace of rural regions migrated to suburban regions. (INTERESTINGLY (H) however, the total population of urban areas remained unchanged. Moving toward 2000, the number of inhabitant(S) of suburban zones doubled. The populace/(DEMOGRAPHIC DISTRIBUTION) of urban areas also increased slightly to 40% and rural regions experienced sharp fall. It is forecasted that, in 2050 the populace of suburban areas will be peaking at 60%(.) (W) whereas, the population of urban areas will (DELETE: be) (REMAIN) unchanged and there will be a further drop in residents of rural regions.
COMMENTS:
HAVE SOME VARIATIONS IN YOUR WORDS FOR POPULATION- DEMOGRAPHIC DISTRIBUTION, POPULATION DENSITY, POPULATION DISTRIBUTION
MIGRATE-MOVEMENT, SHIFT, TRANSFER, RELOCATE OR RESETTLE
OVERALL, I CAN SAY THAT YOU DID WELL YOUR TASK 1.
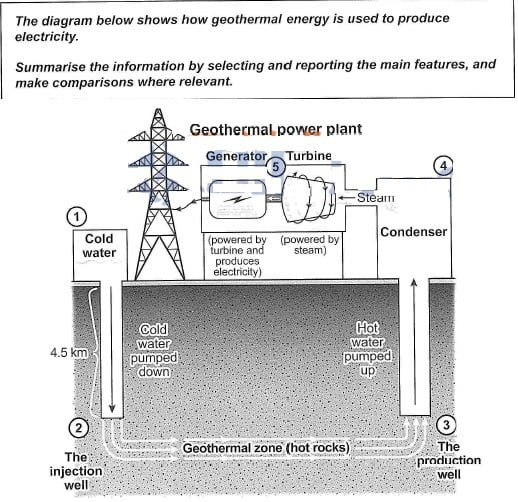
Essay 4 original: The figure gives information about the processes involved in electricity production at a geothermal power plant. Overall, it can be seen that the power production is consisting of five main semens including cold water, the injection well, the production well, condenser, turbine and generator.
At the beginning of the process, the cold water is pumped down 4.5km into the injection well. In the next stage, the cold water is passed through the geothermal zones also known as hot rocks. As a result, it converted into hot water and then it goes into the production well. Afterwards, the hot water is fed into the condenser for further operations.
Following this, the hot water is turned into the steam with the assistance of the condenser. In the next phase, the steam is used to rotate the turbine, which is further connected to the generator via a shaft. As a consequence, the mechanical energy is converted into electrical energy. Finally, the generated electricity is distributed to consumers using electric towers and power transmissions lines.
Essay 4 Evaluation (1)
The figure gives information about the (LINEAR) processes involved in electricity production at a geothermal power plant. Overall, it can be seen that the power (production) (GENERATION) is consisting of five (SEPARATE AND DISTINCT) main (parts) (STAGES) (including) (FROM ) cold water (INFUSION), (DELETE: the injection well, the production well, condenser, turbine and generator.) (UNTIL ELECTRICITY IS CREATED IN THE GENERATOR USING STEAM.)
At the beginning of the process, the cold water is pumped down 4.5km into the injection well. (In the next stage,) (THE) (the) cold water (THEN) is passed through the geothermal zones (also known as)(UNDER THE EARTH WHERE) hot rocks. As a result, (it) (WATER IS) converted into hot water and then it goes into the production well. Afterwards, the hot water is fed into the condenser (for further operations.)
(Following this,) (t) The hot water is turned into (the) steam with the assistance of the condenser. In the next phase, the steam is used to rotate the turbine, which is further connected to the generator via a shaft. As a consequence, the mechanical energy is converted into electrical energy. Finally, the generated electricity is distributed to consumers using electric towers and power transmissions lines. (words: 170)
Essay 4 evaluation (2)
The figure gives information about the processes involved in electricity production at a geothermal power plant. Overall, it can be seen that the power production CONSISTS (DELETE is consisting) of five main sections/SEGMENTS COMMA including cold water infusion, the injection well, the production well, condenser, turbine and generator. GOOD
At the beginning of the process, the cold water is pumped down TO 4.5km into the injection well. In the next stage, the cold water is passed through the geothermal zones also known as THE hot rocks. As a result OF IT, THE WATER GETS HEATED AND FURTHER ACCUMULATED TO (DELETE, it converted into hot water and then it goes into) the production well. Afterwards, the hot water is fed into the condenser for further operations.
Following this, the hot water is turned into the steam with the assistance of the condenser. In the next phase, the steam is used to rotate the turbine, which is further connected to the generator via a shaft. As a consequence, the mechanical energy is converted into electrical energy. Finally, the generated electricity is distributed to consumers using electric towers and power transmissions lines.
DESPITE SOME MINOR ERRORS, IT WAS WRITTEN PRETTY WELL
I LIKE HOW YOU EXPRESSED THE CRUCIAL DETAILS USING VOCABULARY
Possible Scores:
Lexical resources = 8
Coherence and cohesion=7
*TA/TR = 8
Grammar (and Trivial Errors) = 6
whoah this weblog is great i like reading your posts.
Keep up the great work! You realize, lots of persons are looking around for this info, you could aid them greatly.
Thank you