
The chart below shows the amount of money per week spent on fast foods in Britain. The graph shows the trends in consumption of fast foods.
Write a report for a university lecturer describing the information shown below.
You should write at least 150 words.
Task
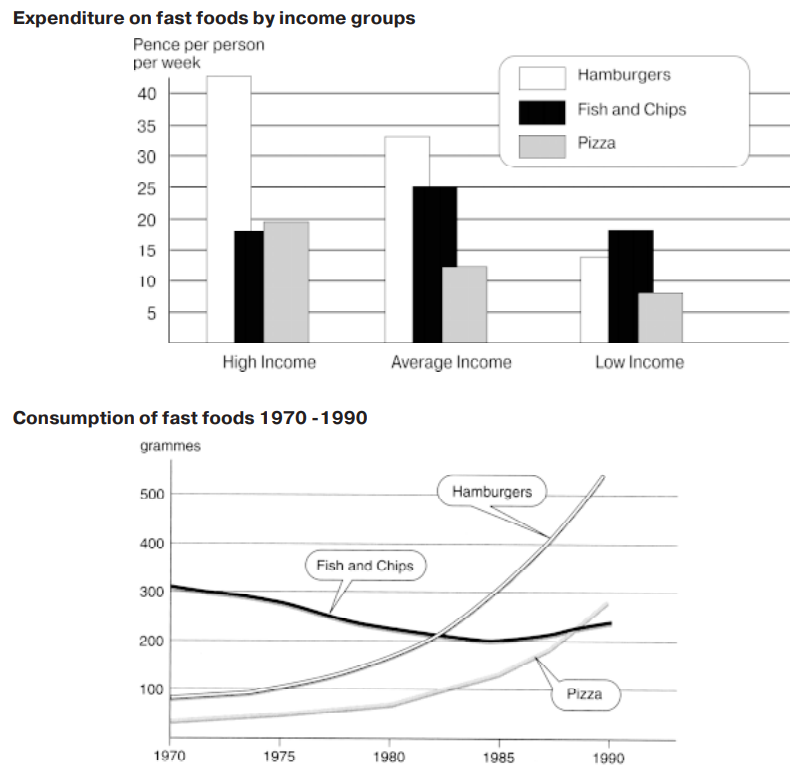
The illustrated bar and line graph show the amount of expenditure and consumption on fast food. The comparison included 3 types of fast food.
Bar chart compares the expenditure on fast food by 3 different income groups. The highest amount of expenditure was on hamburger, while the lowest amount was on pizza. High and low income spent around the same amount on fish and chips. By around 25 pence per person per weak, average income spent the highest amount on fish and chips.
The line graph gives information about the usage of fast food between 1970 and 1990. In general, the demand on pizza and hamburger increased gradually, on the other hand, the demand on fish and chips decreased dramatically. Hamburger and pizza reached the peak on 1990, while fish and chips were very popular in 1970.
Evaluation
The illustrated bar and line graph show the amount of expenditure and consumption on fast food(S) IN BRITAIN. The comparison included 3 THREE types of fast food. TIMELINE IS NOT SPECIFIED. ALSO MENTION THE DATA CALIBRATION IN?
OVERALL PARAGRAPH IS MISSING
THE Bar chart compares the expenditure on fast food by 3 THREE different income groups. OVERALL, The highest amount of expenditure was on hamburgerS, while the lowest amount was on pizza. High and low income spent around the same amount on fish and chips (? INAPPROPRIATE). By around 25 pence per person per weak WEEK, average income spent the highest amount on fish and chips. DETAILS ARE MISSING, NUMBERS SHOULD BE EXPRESSED IN BODY PARAGRAPHS OF YOUR REPORT.
(DELETE The line graph gives information about the usage of fast foodS, YOU ALREADY MENTIONED THIS IN INTRO PARAGRAPH) between 1970 and 1990. In general, the demand on FOR pizza and hamburger increased gradually, on the other hand, the demand on FOR fish and chips decreased dramatically YOU CANNOT GIVE GENERAL STATEMENTS IN A REPORT, ESPECIALLY IN BODY PARAGRAPHS. Hamburger and pizza reached the peak on 1990, while fish and chips were very popular in 1970.
137 WORDS, UNDER THE WORDS LIMIT. WEAK EXPRESSIONS. REFER THE BOOKS POSTED UNDER FILE SECTION, LEARN THE STRUCTURE AND FORMATION OF REPORTS. ATTEMPT THIS TASK AGAIN.
Predicted score
Lexical resource = 5
Coherence and cohesion= 6
Task response = 5
Grammar (and Trivial Errors) =5
Thanks for reading this article and share it with your friends so they can prevent these common mistakes. For more information and tips, visit Facebook group IELTS Assistance (Free Writing Evaluation & Guidance).